Banking Transactions & Accounts – Power BI Dashboard
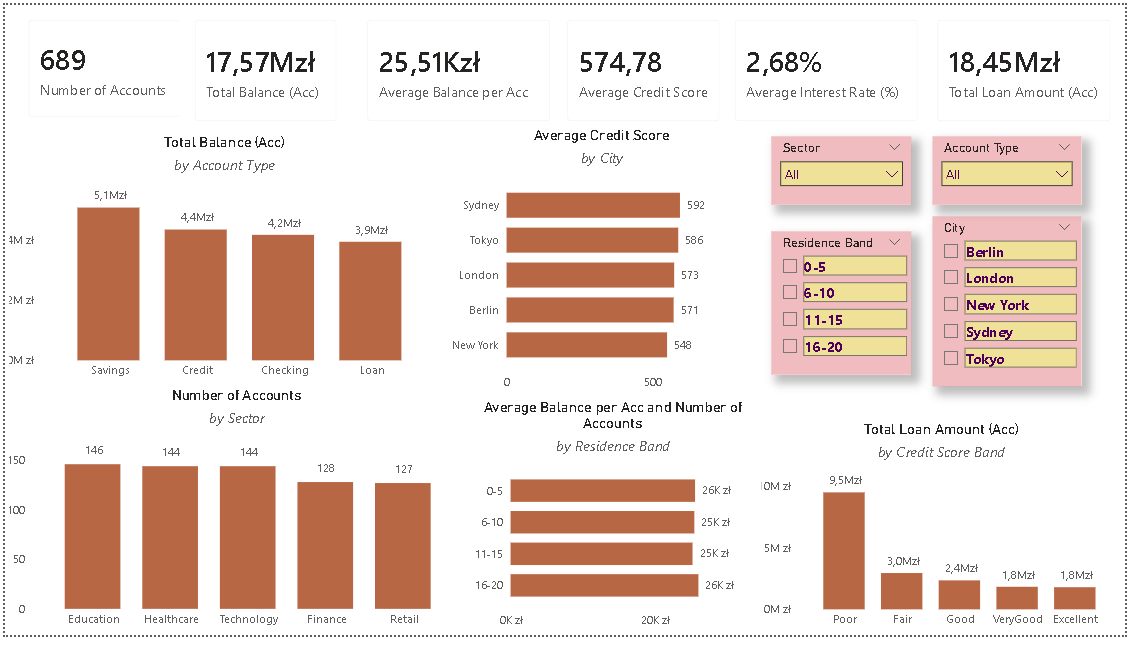
Built an end‑to‑end financial analytics Power BI solution on synthetic banking data.
Modeling transactions and accounts in a star schema and cleaning multi‑currency, interest rate, and date fields made in Power Query.
The main dashboard analyzes transaction volumes and values over time, by city and transaction type, with dynamic filters for year,
account type, and currency. The accounts dashboard focuses on portfolio quality and risk, showing balances, loan exposure,
credit score and residence‑time bands by sector, city, and product type, with KPI cards and interactive drill‑downs.
Bank Customer Churn Analysis – Power BI Dashboard
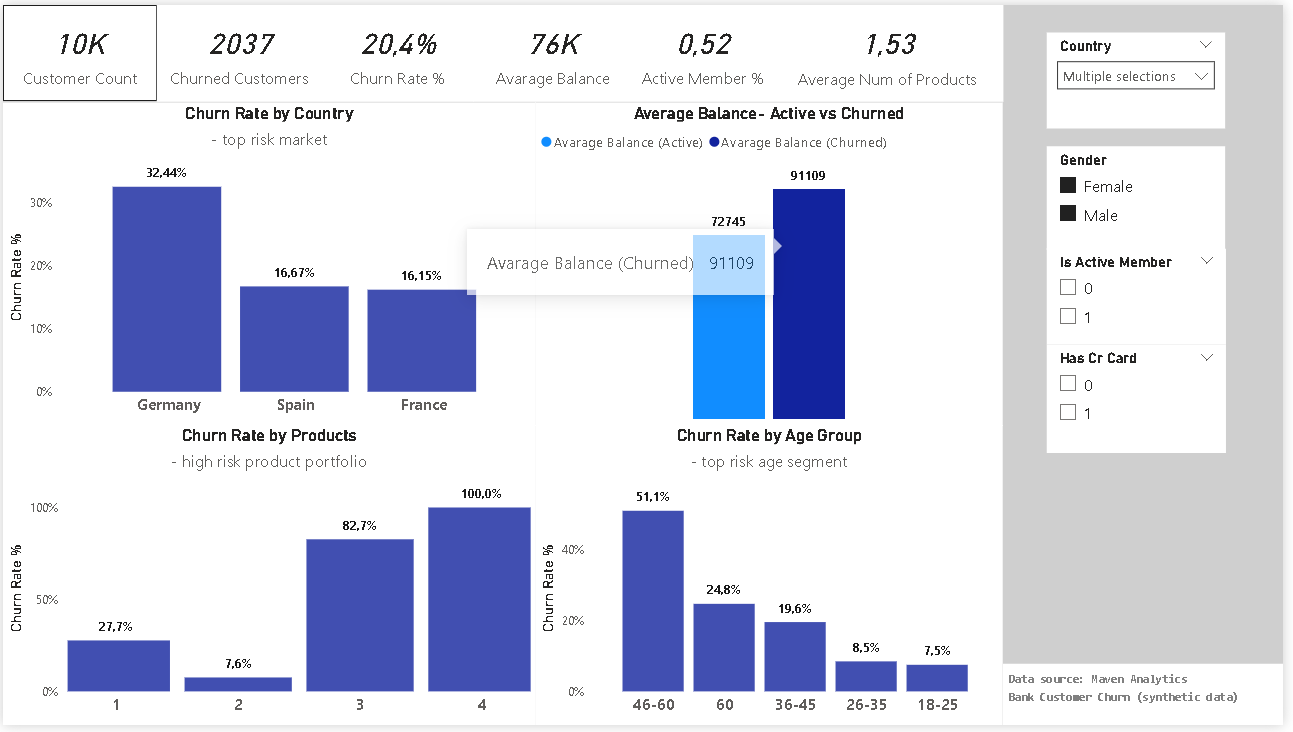
Interactive Power BI dashboard exploring churn behaviour of 10K retail bank customers.
Shows key KPIs and visualizes churn by geography, number of products and age group to highlight the riskiest customer segments and support decisions for marketing and risk teams.

A simple Python-based command-line interface (CLI) to explore Spotify data.
You can search for artists, fetch their top songs by country, list top artists by genre, and more — all from your terminal.
ETL pipeline on Anti Money Laundering project using PySpark

This project implements a complete, robust, and automated ETL (Extract, Transform, Load) pipeline designed to process financial transaction data for Anti-Money Laundering (AML) purposes. The pipeline is built using a modern data engineering stack, including Python, Apache Spark, PostgreSQL, and Docker.
Tableau Dashboard
Coffee Quality Analysis
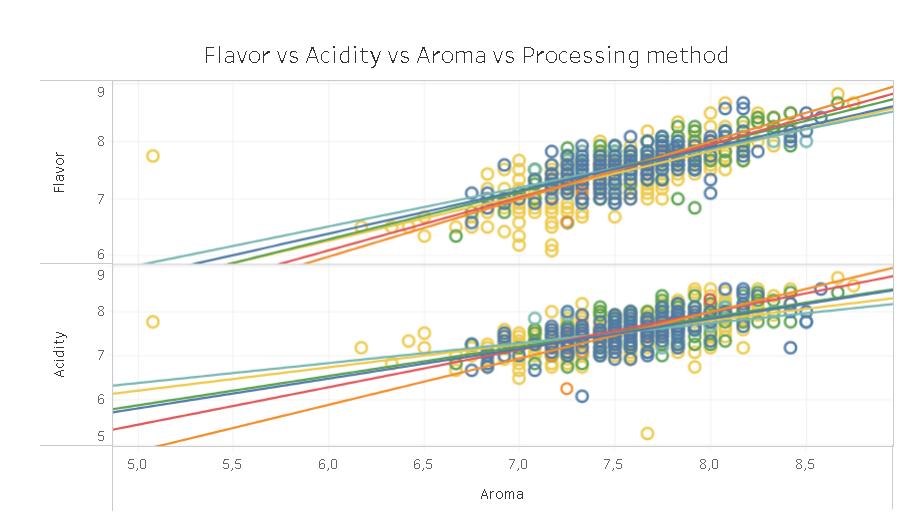
What makes your morning coffee so special? Is it country of origin or coffee variety? Or maybe it is a processing method that stands behind the producer?
Tableau Dashboard
Global Coffee Trade from 1990 to 2020
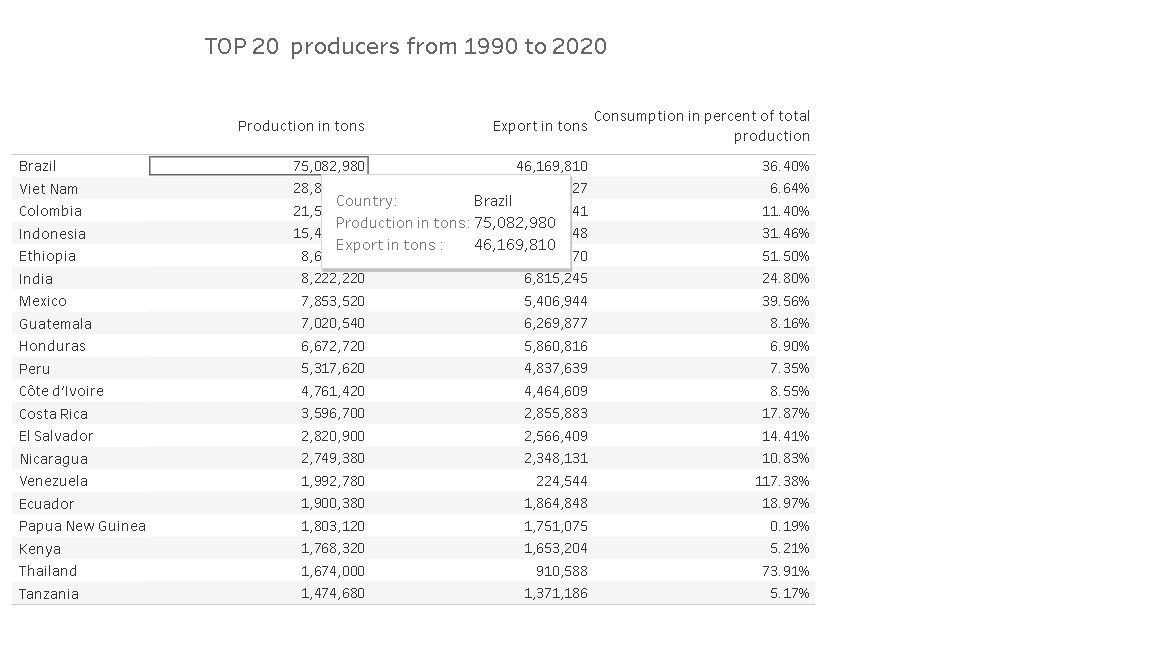
Global Coffee Trade from 1990 to 2020. Coffee production and domestic consumption. Biggest exporter and importer of green coffee beans.
![]()
An exploratory data analysis project on Covid19 cases, deaths, and vaccinations from, 1st Jan, 2020 to September 2023.
Diving into some key metrics related to pandemic - deaths and vaccination around the globe.
![]()
An exploratory data analysis project on Covid19 PART2 - vaccinations from, 1st Jan, 2020 to September 2023.